The Deeper, The Harder
第一个实验属于热身,只需要我们去调用系统提供的接口,称之为系统调用(System Calls)。而这个实验就要揭开操作系统的黑盒,看看系统调用的原理并写几个新的系统调用。
配环境:基于qemu的gdb调试
第一题出了几个填空题,目的是为了学会用gdb调试kernel。因为是基于qemu接的gdb,需要在两个终借用网络端口进行远程调试。具体操作为:
- 执行
make qemu-gdb。最后会输出一个端口号,like:
1
2
3
|
# make qemu-gdb
*** Now run 'gdb' in another window.
qemu-system-riscv64 -machine virt -bios none -kernel kernel/kernel -m 128M -smp 3 -nographic -global virtio-mmio.force-legacy=false -drive file=fs.img,if=none,format=raw,id=x0 -device virtio-blk-device,drive=x0,bus=virtio-mmio-bus.0 -S -gdb tcp::25000
|
- 开一个新的终端,执行
gdb-multiarch。然后执行:
 1
 2
 3
 4
 5
 6
 7
 8
 9
10
11
12
13
14
15
16
17
18
|
(gdb) target remote localhost:25000
Remote debugging using localhost:25000
warning: Architecture rejected target-supplied description
warning: No executable has been specified and target does not support
determining executable automatically.  Try using the "file" command.
Truncated register 37 in remote 'g' packet
(gdb) set architecture riscv:rv64 # 实验手册没提到架构,不指定架构会崩屎
The target architecture is assumed to be riscv
(gdb) file kernel/kernel
Reading symbols from kernel/kernel...
(gdb) b syscall
Breakpoint 1 at 0x8000203c: file kernel/syscall.c, line 133.
(gdb) c
Continuing.
[Switching to Thread 1.3]

Thread 3 hit Breakpoint 1, syscall () at kernel/syscall.c:133
133     {
|
实际上,gdb也会提示我们,项目根目录里有一个.gdbinit配置文件,只需要在家目录的.gdbinit中引入:
1
|
add-auto-load-safe-path /xv6-labs-2023/.gdbinit
|
即可不用每次都输入上述操作。
并且作为CTFer,当然不能满足于原生gdb了,所以我直接——
peda,启动!!
这一启动不要紧,遇到一堆关于riscv的bug。
首先是启动 gdb-multiarch 时需要确保export LC_CTYPE=C.UTF-8,因为docker基础镜像是极简版系统,对字符集支持不友好。
然后peda能正常调试,但是不能展示那四个面板,这就意义不大了。所以我直接——
pwndbg,启动!!
然后就直接:
1
2
|
0x0000000000001000 in ?? ()
Exception occurred: context:  (<class 'NotImplementedError'>)
|
原来是代码没写完,那真的没事了。所以我直接——
gef,启动!!
万幸这次能显示面板了。看了眼github,还得是gef更新的勤快。
peda, pwndbg, gef都是CTF中pwn方向常用的gdb的增强插件,但他们不能同时使用。
Lab2 SysCall
终于搞好环境,虽然看起来是无用的折腾,但是为后面更复杂的调试打下了坚实的基础(你最好是)。
填空题
填空题没法打分,目的是帮助我们后续进行内核报错的调试
-
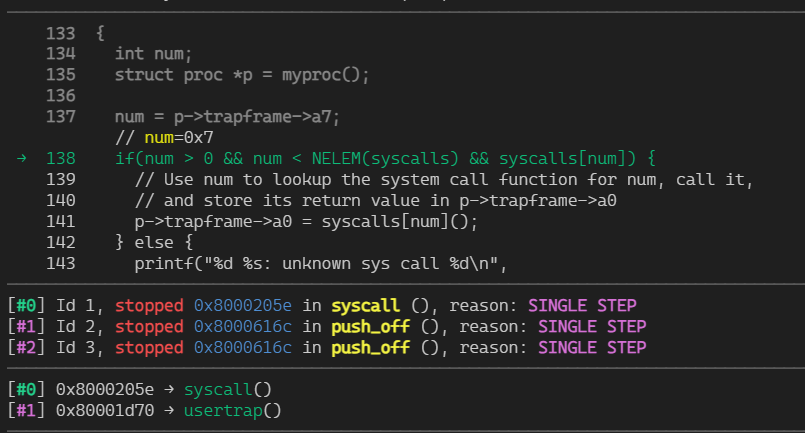
Q: 查看backtrace输出,哪个函数调用 syscall 了?
-
Q: p->trapframe->a7 的值是多少,这个值代表什么?(提示:查看 user/initcode.S,这是 xv6 启动的第一个用户程序。)
- A: gef直接打印出来了,但也可以使用
p *p.trapframe查看。结合源代码可知,a7是系统调用的索引。当前要执行的系统调用是sys_exec
-
Q: CPU 之前处于什么模式?
-
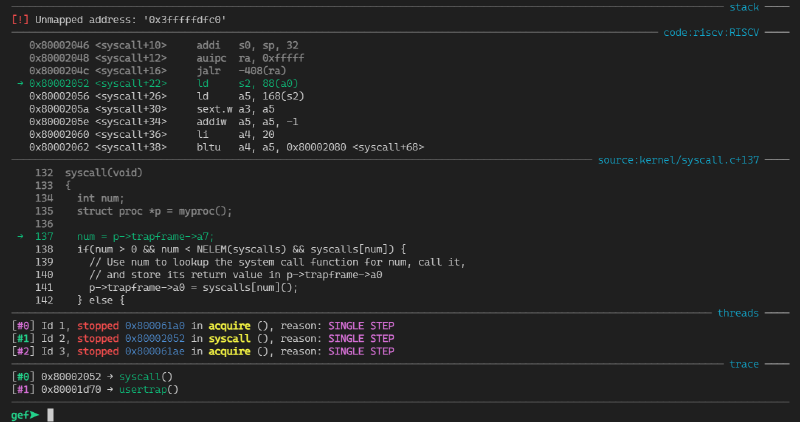
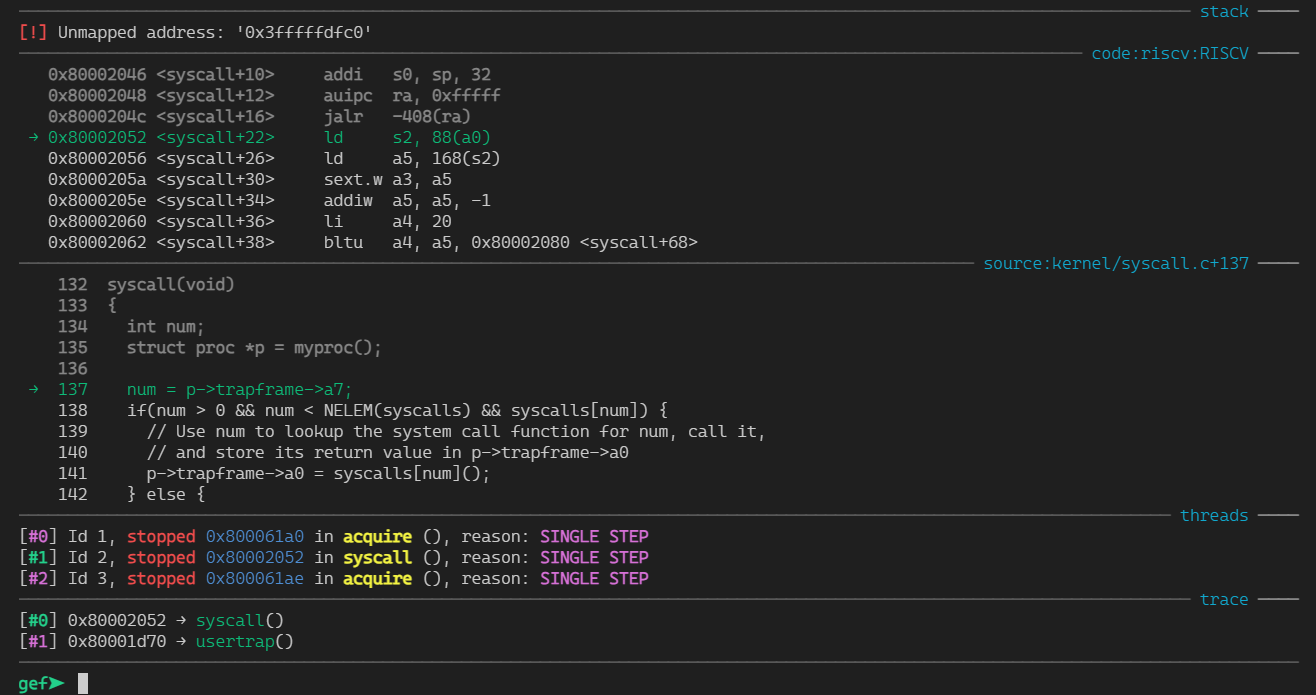
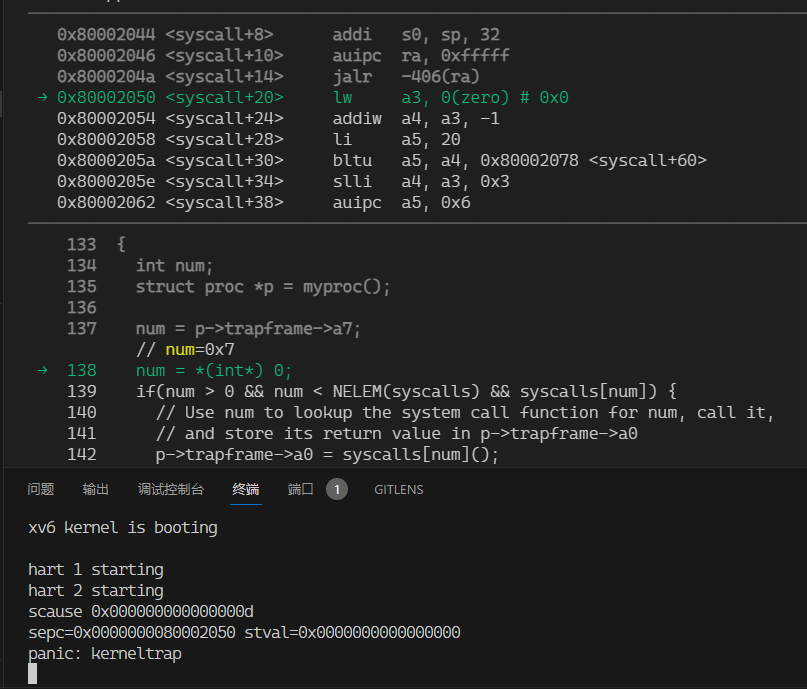
Q: 瞎几把改下指针让内核崩溃(比如num = * (int *) 0)。记录内核发生 panic 的汇编指令。哪个寄存器对应于变量 num?
- A: spec寄存器表示崩溃指令的地址。gef直接查看。也可以查看
kernel/kernel.asm
-
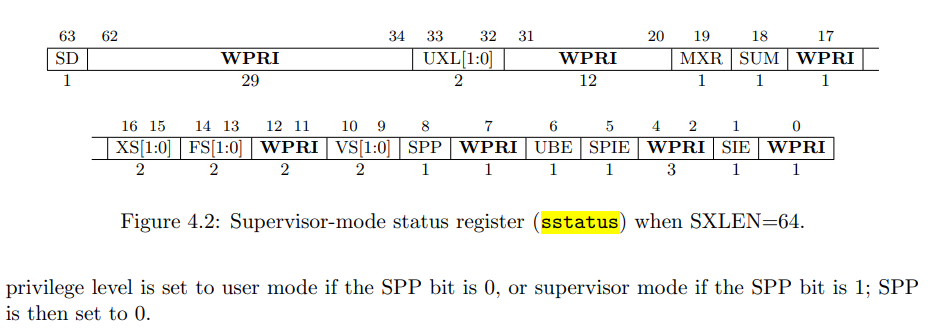
Q: 为什么内核会崩溃?
- A: scause寄存器表示崩溃根因。具体内容在手册71页的表4.2。我们的崩溃的scause为0xd,查表得“13 Load page fault”,表明0不能被映射到内核地址空间。
-
Q: 内核崩溃时运行的二进制文件的名称是什么?它的进程 pid 是什么?
riscv的中文参考资料:https://blog.csdn.net/zzy980511/article/details/130642258
Lab2-1: tracing
trace(1 << SYS_call)系统调用输入一个掩码,表示系统调用号。当执行指定的系统调用时打印点东西,包括pid,第系统调用名和返回值:<pid>:syscall <syscall> -> <ret>
首先梳理一下系统调用的调用链:
用户侧
UPROGS += $U/_trace: 用户态的user/trace.c是系统调用int trace(int)的测试程序,实验已经给出。user/user.h 需要增加int trace(int)的声明user/usys.pl 用于生成usys.S,里面是系统调用的stub。stub是从用户态到内核态的桥梁。
 1
 2
 3
 4
 5
 6
 7
 8
 9
10
11
12
|
# Generate usys.S, the stubs for syscalls.
print "#include \"kernel/syscall.h\"\n";
sub entry {
    my $name = shift;
    print ".global $name\n";
    print "${name}:\n";
    print " li a7, SYS_${name}\n";
    print " ecall\n"; # 进入内核态
    print " ret\n";
}
entry("trace");
# ...
|
内核侧
kernel/syscall.h 定义系统调用的索引kernel/syscall.c 所有系统调用的通用接口,根据传入的索引进行转发。kernel/sysproc.c 系统调用的具体实现
1
2
3
4
5
6
7
8
|
uint64
sys_trace(void)
{
  int mask;
  argint(0, &mask);
  myproc()->tracemask |= mask;
  return 0;
}
|
修改内核代码
至此走完了一个系统调用的完整调用链。但对trace来说,还需要修改内核代码实现我们需要的功能:
kernel/proc.h: struct proc用于定义一个进程。pid是本来就有的字段,我们需要增加trace掩码字段。
 1
 2
 3
 4
 5
 6
 7
 8
 9
10
11
12
13
14
15
16
17
18
19
20
21
22
23
24
25
|
struct proc {
  struct spinlock lock;

  // p->lock must be held when using these:
  enum procstate state;        // Process state
  void *chan;                  // If non-zero, sleeping on chan
  int killed;                  // If non-zero, have been killed
  int xstate;                  // Exit status to be returned to parent's wait
  int pid;                     // Process ID

  // wait_lock must be held when using this:
  struct proc *parent;         // Parent process

  // these are private to the process, so p->lock need not be held.
  uint64 kstack;               // Virtual address of kernel stack
  uint64 sz;                   // Size of process memory (bytes)
  pagetable_t pagetable;       // User page table
  struct trapframe *trapframe; // data page for trampoline.S
  struct context context;      // swtch() here to run process
  struct file *ofile[NOFILE];  // Open files
  struct inode *cwd;           // Current directory
  char name[16];               // Process name (debugging)
  uint64 tracemask;            // tracemask
  uint64 arg;                  // Extra: int arg
};
|
kernel/proc.c 这里实现trace掩码的初始化和fork克隆
 1
 2
 3
 4
 5
 6
 7
 8
 9
10
11
12
|
static struct proc*
allocproc(void)
{
  // ...
  p->tracemask = 0;
}
int
fork(void)
{
  // ...
  np->tracemask = p->tracemask;
}
|
kernel/syscall.c:syscall() 这里实现打印输出部分
 1
 2
 3
 4
 5
 6
 7
 8
 9
10
11
12
13
14
15
16
17
18
19
20
21
|
void
syscall(void)
{
  int num;
  struct proc *p = myproc();

  num = p->trapframe->a7;
  if(num > 0 && num < NELEM(syscalls) && syscalls[num]) {
    // Use num to lookup the system call function for num, call it,
    // and store its return value in p->trapframe->a0
    p->trapframe->a0 = syscalls[num]();
    if (p->tracemask & (1 << num)) { // << 判断是否需要trace这个系统调用
      printf("%d: syscall %s -> %d\n", p->pid, syscall_name[num], p->trapframe->a0);
      // syscall_name整一个字符串数组即可,注意第0个元素置空
    }
  } else {
    printf("%d %s: unknown sys call %d\n",
            p->pid, p->name, num);
    p->trapframe->a0 = -1;
  }
}
|
kernel/syscall.c中还实现了获取系统调用参数的辅助函数:argint(int n, int *ip)、argstr(int n, char *buf, int max)等。本质上就是读通用寄存器。
如果直接在trace输出时再去读寄存器,由于此时系统调用已经结束,无法获取参数。为了将参数传回syscall()入口,需要继续为proc结构体添加一个字段。同时hook获取参数的函数:
1
2
3
4
5
6
7
|
// Fetch the nth 32-bit system call argument.
void
argint(int n, int *ip)
{
  *ip = argraw(n);
  myproc()->arg = *ip;
}
|
这里只展示了提取一个int,至于更复杂的参数也只是增加处理逻辑而已。
Lab2-2: sysinfo
sysinfo 系统调用收集运行时系统信息。实验给出了数据结构定义:
1
2
3
4
|
struct sysinfo {
  uint64 freemem;   // amount of free memory (bytes)
  uint64 nproc;     // number of process
};
|
完善调用链的操作大同小异。我们重点关注两个字段的获取:
free memory bytes
实验指引我们查看kernel/kalloc.c:
1
2
3
4
5
6
7
8
|
struct run {
  struct run *next;
};

struct {
  struct spinlock lock;
  struct run *freelist;
} kmem;
|
可以看到这个简陋的动态内存管理机制使用了单链表来存储可用内存。于是空余字节的数量就是单链表进行求和
 1
 2
 3
 4
 5
 6
 7
 8
 9
10
11
12
13
14
|
// kernel/kalloc.c
uint64
kfreemem(void) {
  struct run *r;
  uint64 free = 0;
  acquire(&kmem.lock); // 模仿kalloc函数进行上锁
  r = kmem.freelist;
  while (r) {
    free += PGSIZE; // PGSIZE固定4096字节
    r = r->next;
  }
  release(&kmem.lock);
  return free;
}
|
至此功能已经完成了,但是很奇怪打分脚本是如何评分的。查看user/sysintotest.c可以发现使用了sbrk系统调用。这个函数的作用是增加或减少进程的堆大小。于是计算空闲内存的逻辑是:用sbrk填满所有内存,计算增加的页数量。
number of process
进程管理的逻辑位于kernel/proc.c:
 1
 2
 3
 4
 5
 6
 7
 8
 9
10
11
12
13
14
|
// initialize the proc table.
void
procinit(void)
{
  struct proc *p;

  initlock(&pid_lock, "nextpid");
  initlock(&wait_lock, "wait_lock");
  for(p = proc; p < &proc[NPROC]; p++) {
      initlock(&p->lock, "proc");
      p->state = UNUSED;
      p->kstack = KSTACK((int) (p - proc));
  }
}
|
proc[NPROC]数组维护所有进程的proc结构体。进程状态在proc结构体中由一个枚举标记:
1
2
|
// kernel/proc.h
enum procstate { UNUSED, USED, SLEEPING, RUNNABLE, RUNNING, ZOMBIE };
|
于是计算进程数量就是对列表中状态不是UNUSED的进程进行求和;
1
2
3
4
5
6
7
8
|
uint64
count_proc(void) {
  struct proc *p;
  uint64 count = 0;
  for(p = proc; p < &proc[NPROC]; p++)
    if(p->state != UNUSED) count += 1;
  return count;
}
|
最后注意在kenel/defs.h中加入这两个函数的声明。
load average的计算公式基本上就是:
关于进程数已经实现了,只需要统计SED, SLEEPING, RUNNABLE, RUNNING这些状态的进程即可。
关于内核数量,kenel/param.h中的NCPU已经指定了最大处理器逻辑核数量。
计算输出即可。而现代linux系统计算load average一般还要记录3分钟,5分钟,15分钟的数值。vx6对时间的支持并不友好,此题再议。
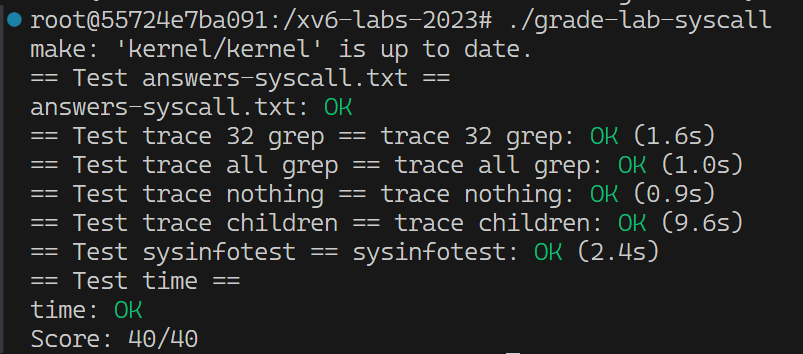
打个分⑧